Micon has successfully evaluated the effect of minimum mining dimensions on operational dilution for an open pit mine, narrow-vein deposit.
This study involved generating and analyzing 24 different minimum mining dimension scenarios. The expected operational dilution within the designed pit was calculated on a bench-by-bench basis for each of the 24 scenarios. A wide number of scenarios representing various operational possibilities were modelled because the quality of the operational precision/selectivity in the future is not known.
Datamine’s Minable Shape Optimizer (MSO) was used to generate specified minable shapes mimicking different operational strategies and/or outcomes. These shapes were then evaluated against the block model to determine the amount of dilution, the grade of dilution and the overall tonnes and grade for each mining shape that met a cut-off grade criterion.
The output summary reports for all 24 scenarios were combined into a single excel file and a python script was developed to use the data in this file to calculate operational dilution bench by bench for all 24 scenarios and to summarize the outputs of this study in the a form of tables, box plots, histograms and scatter plots.
The results obtained from this script can be used to i) guide the amount of dilution to be expected during production; ii) help to form the selection criteria for sizing production mining equipment; and iii) help identify areas within the pit where high operational dilution can be expected and/or avoided through adopting selective mining practices.
This process can be executed in just a few days depending on the size and format of the block model and the number of scenarios that need to be generated using Datamine’s MSO Software. Once the python script is generated to read the output data, the analysis and reporting takes only minutes.
This work process can also be used to investigate the expected external operational dilution within different geological/geomechanical zones inside your orebody, bench by bench and across multiple scenarios. Moreover, uncertainty in geology and grade distribution can be also incorporated when running dilution scenarios. Those sources of uncertainty can be quantified by generating simulated models for rock types and grades using sequential gaussian simulation and sequential indicator simulation.
Figure 1 shows box plots of the dilution for all benches by scenario. Figure 2 shows the variation of expected dilution values for all scenarios by bench elevation. Figure 3 shows histograms of average dilution values for the 24 scenarios.
Figure 1: Boxplot Output of Dilution Estimations for 24 Minimum Mining Dimension Scenarios
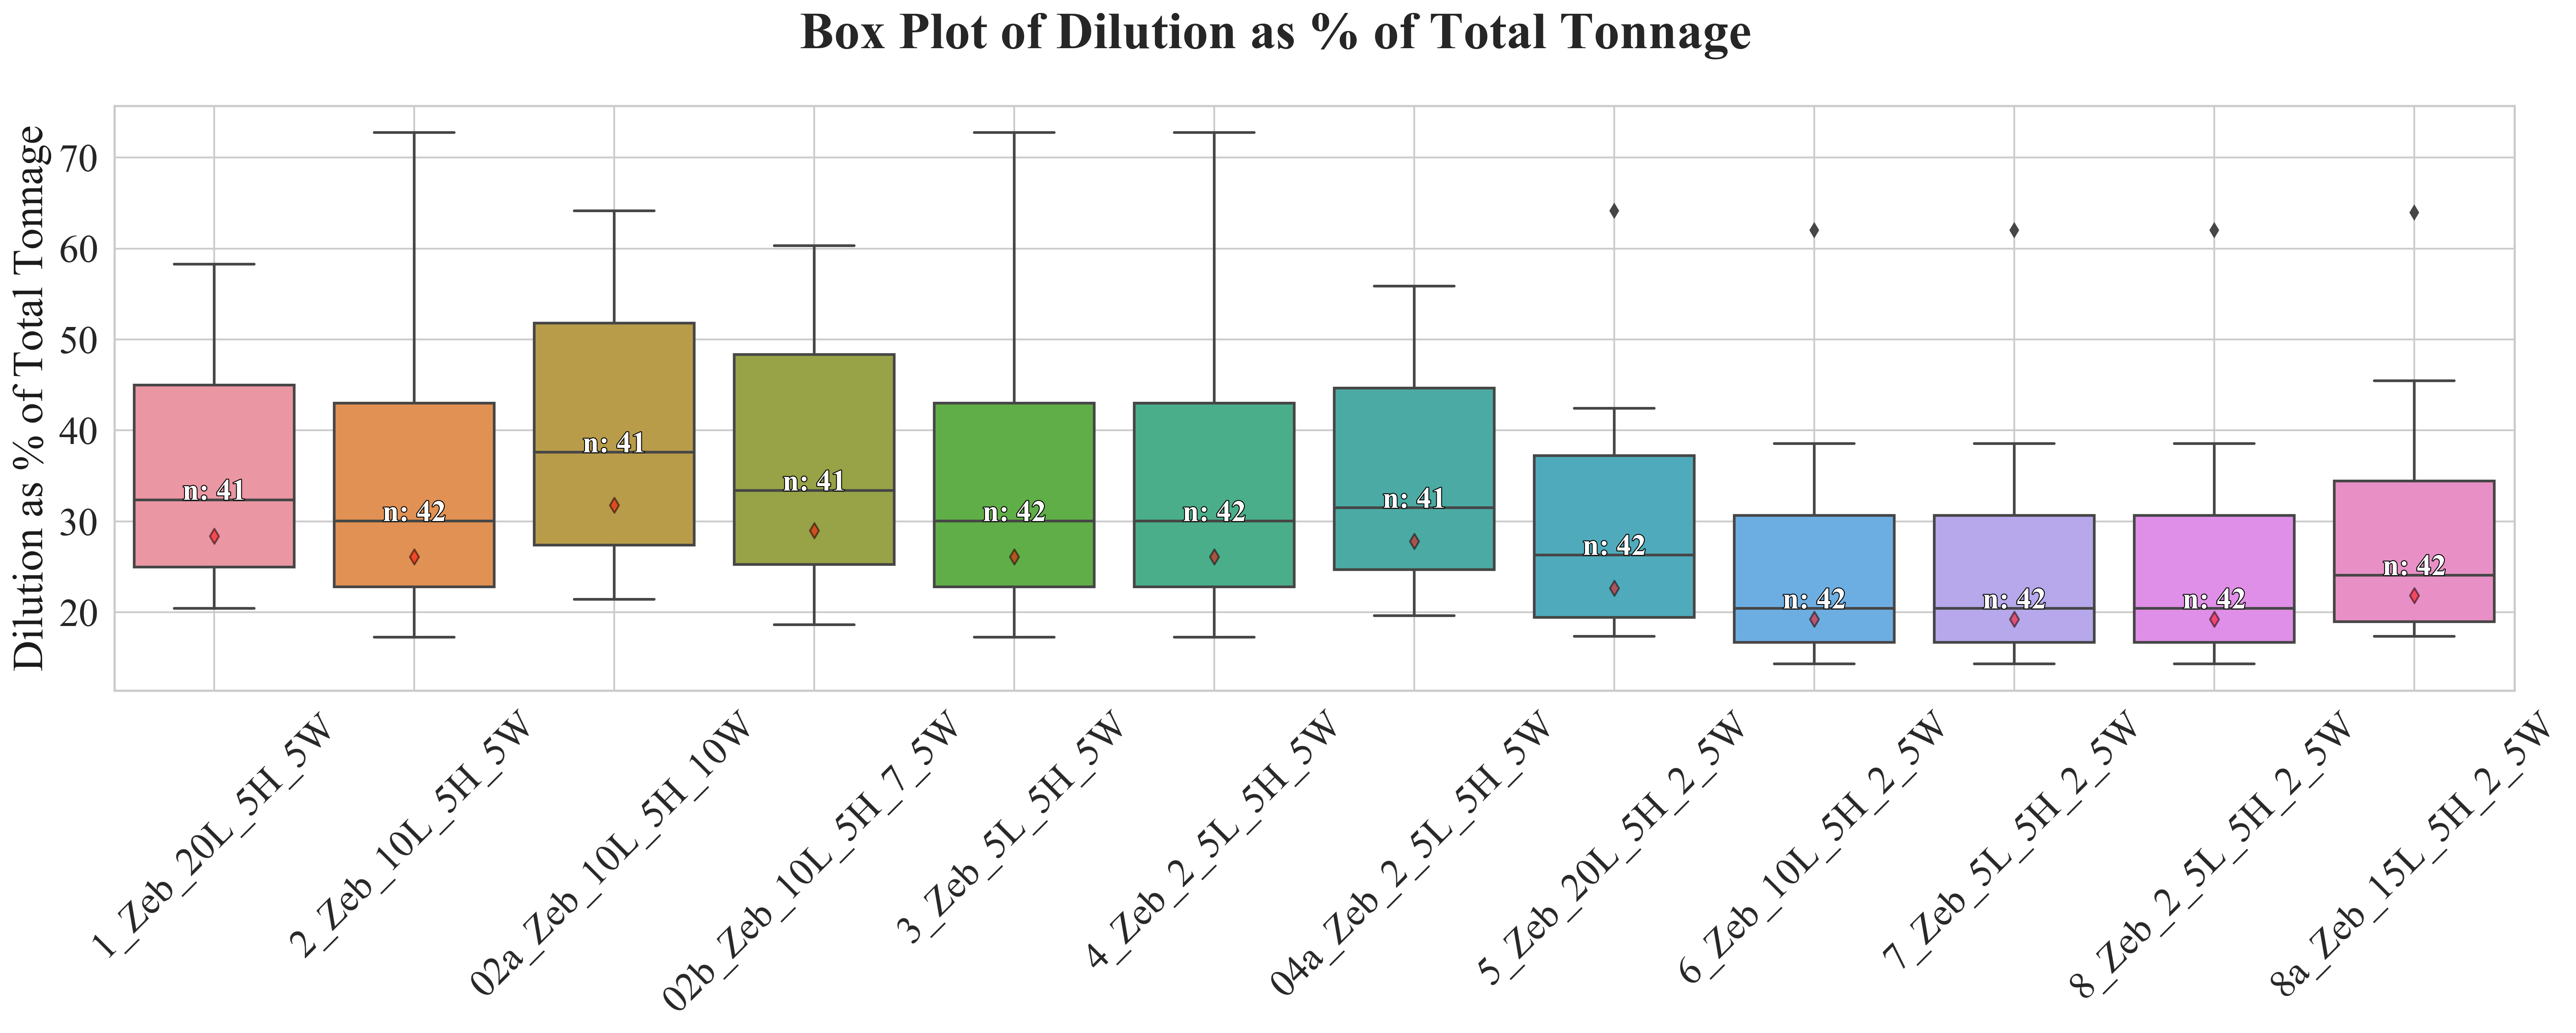
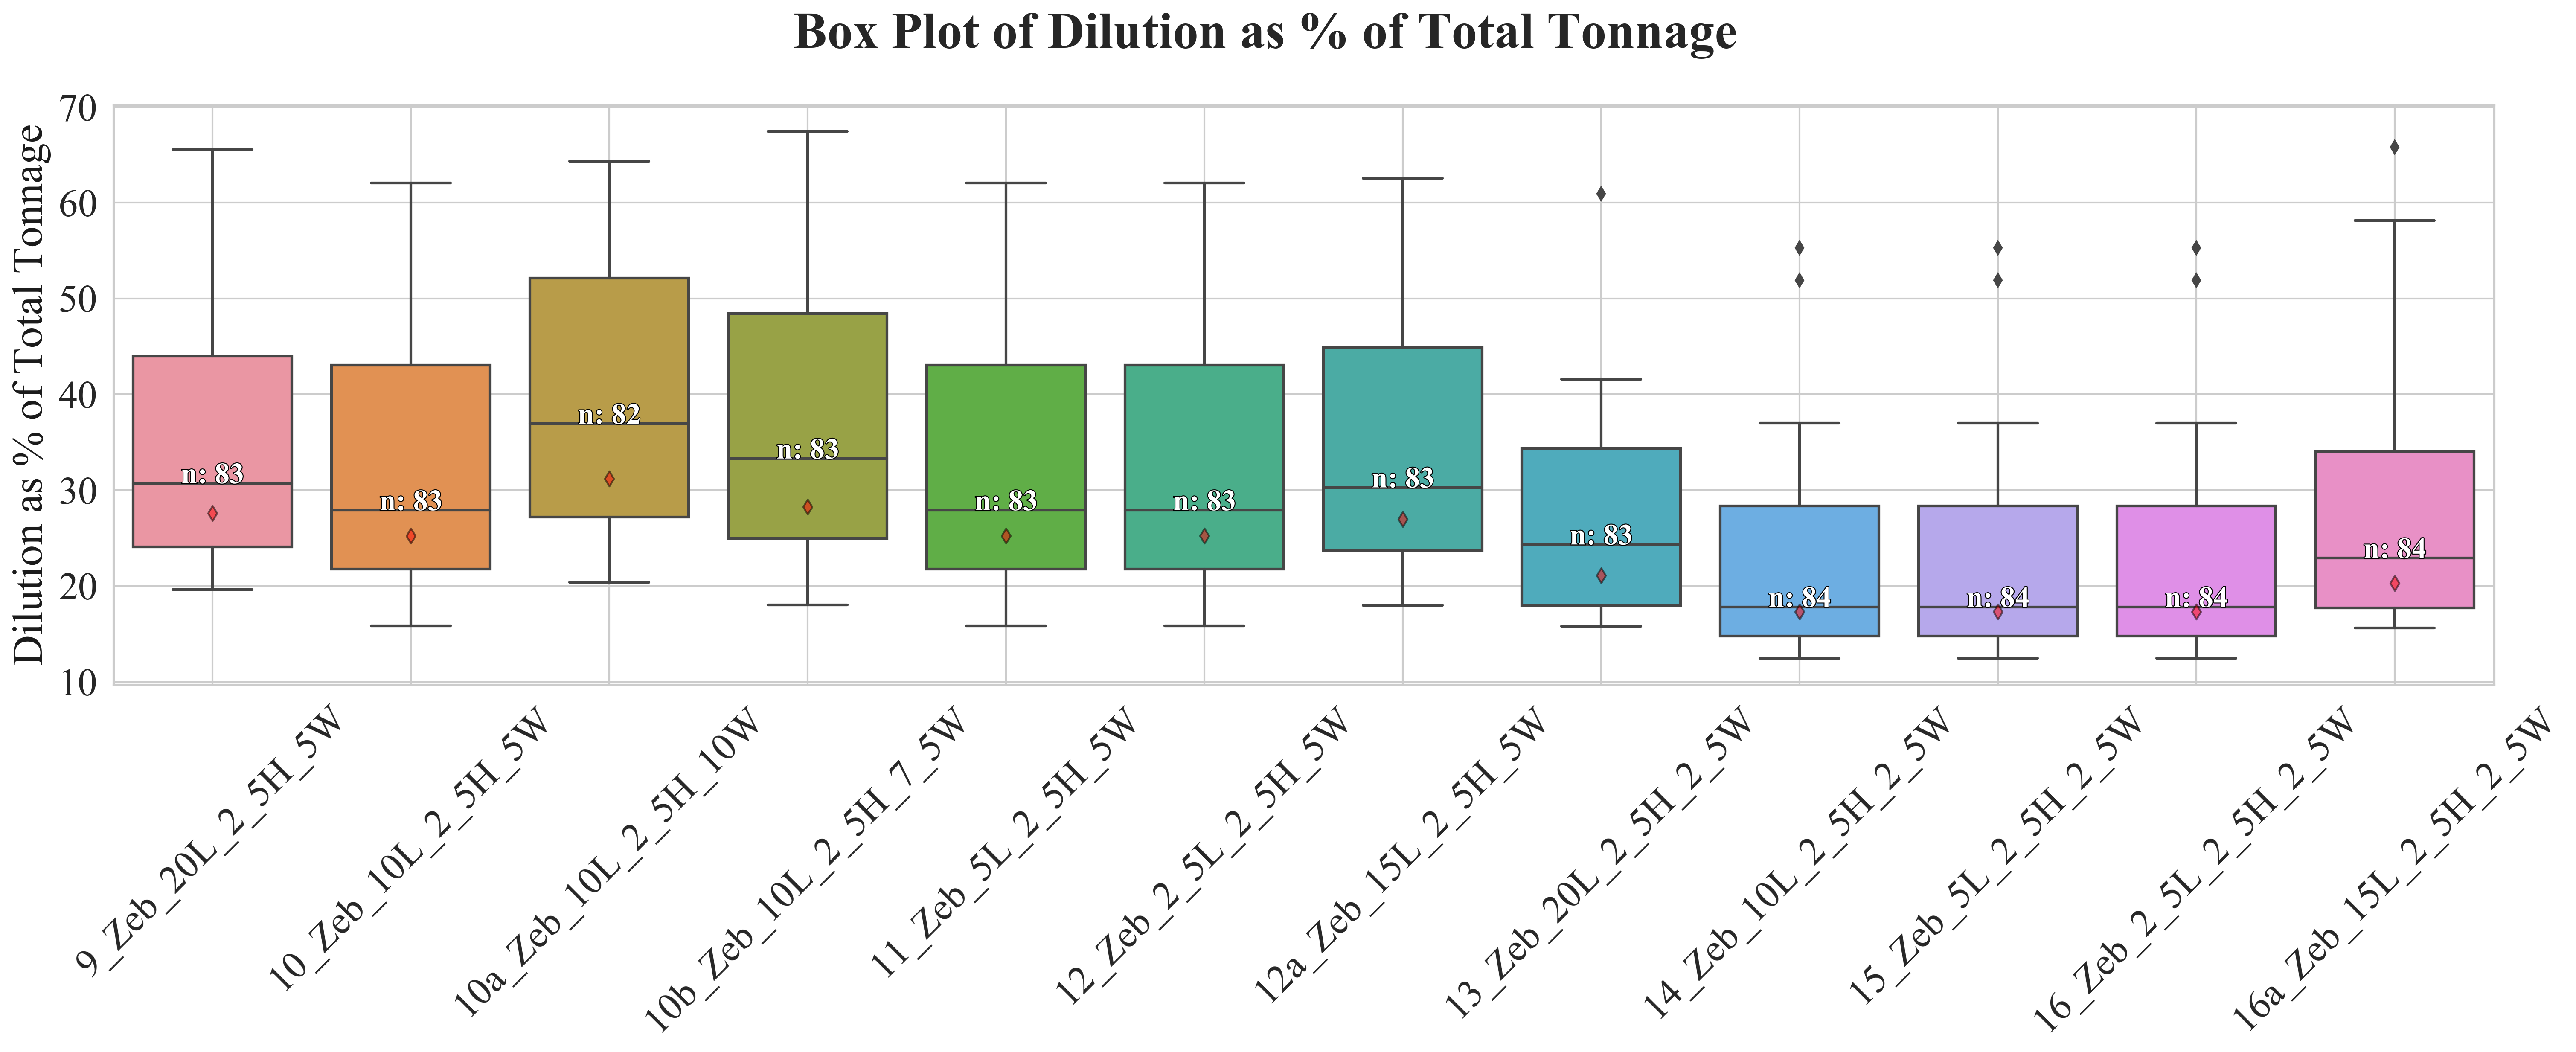
Source: Micon, 2020.
Figure 2: Graph of the Dilution as a Percentage of Total Tonnage and
Percentage of Ore for 24 Minimum Mining Dimension Scenarios: by Bench Elevation
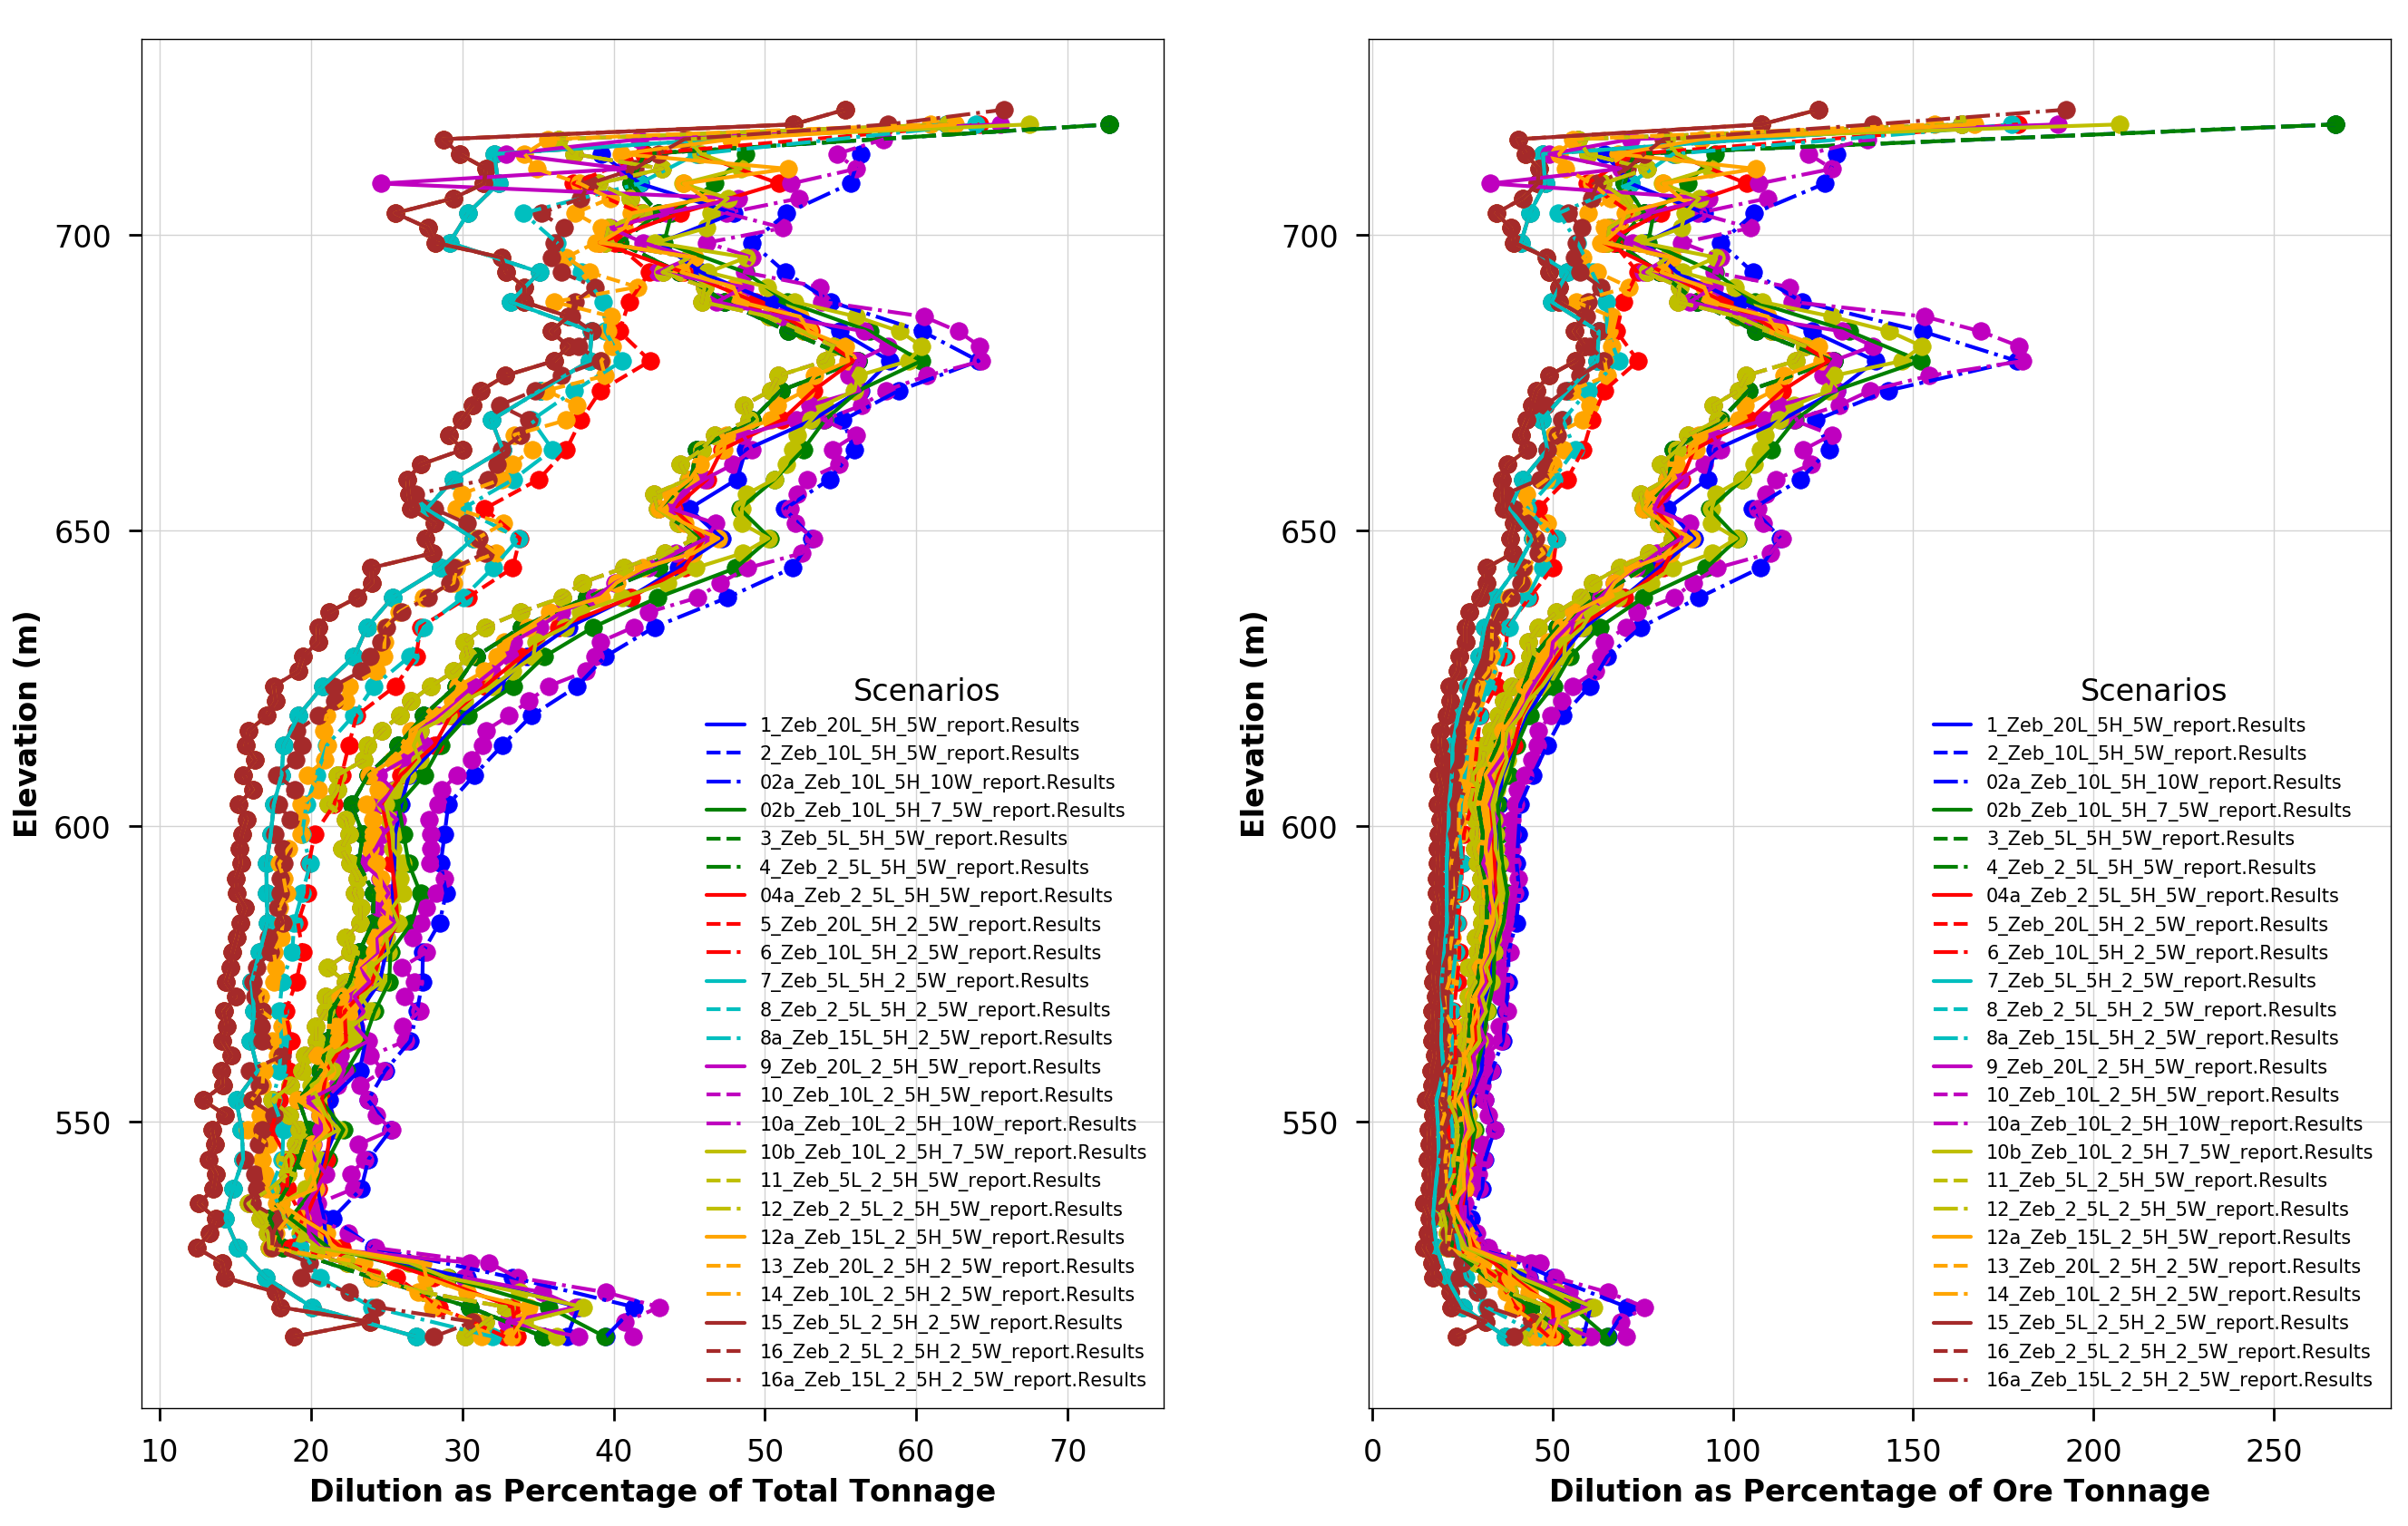
Source: Micon, 2020.
Figure 3: Histograms of Average Dilution Values for 24 Minimum Mining Dimension Scenarios:
i) Percentage of Total Tonnage; and ii) Percentage of Ore Tonnage
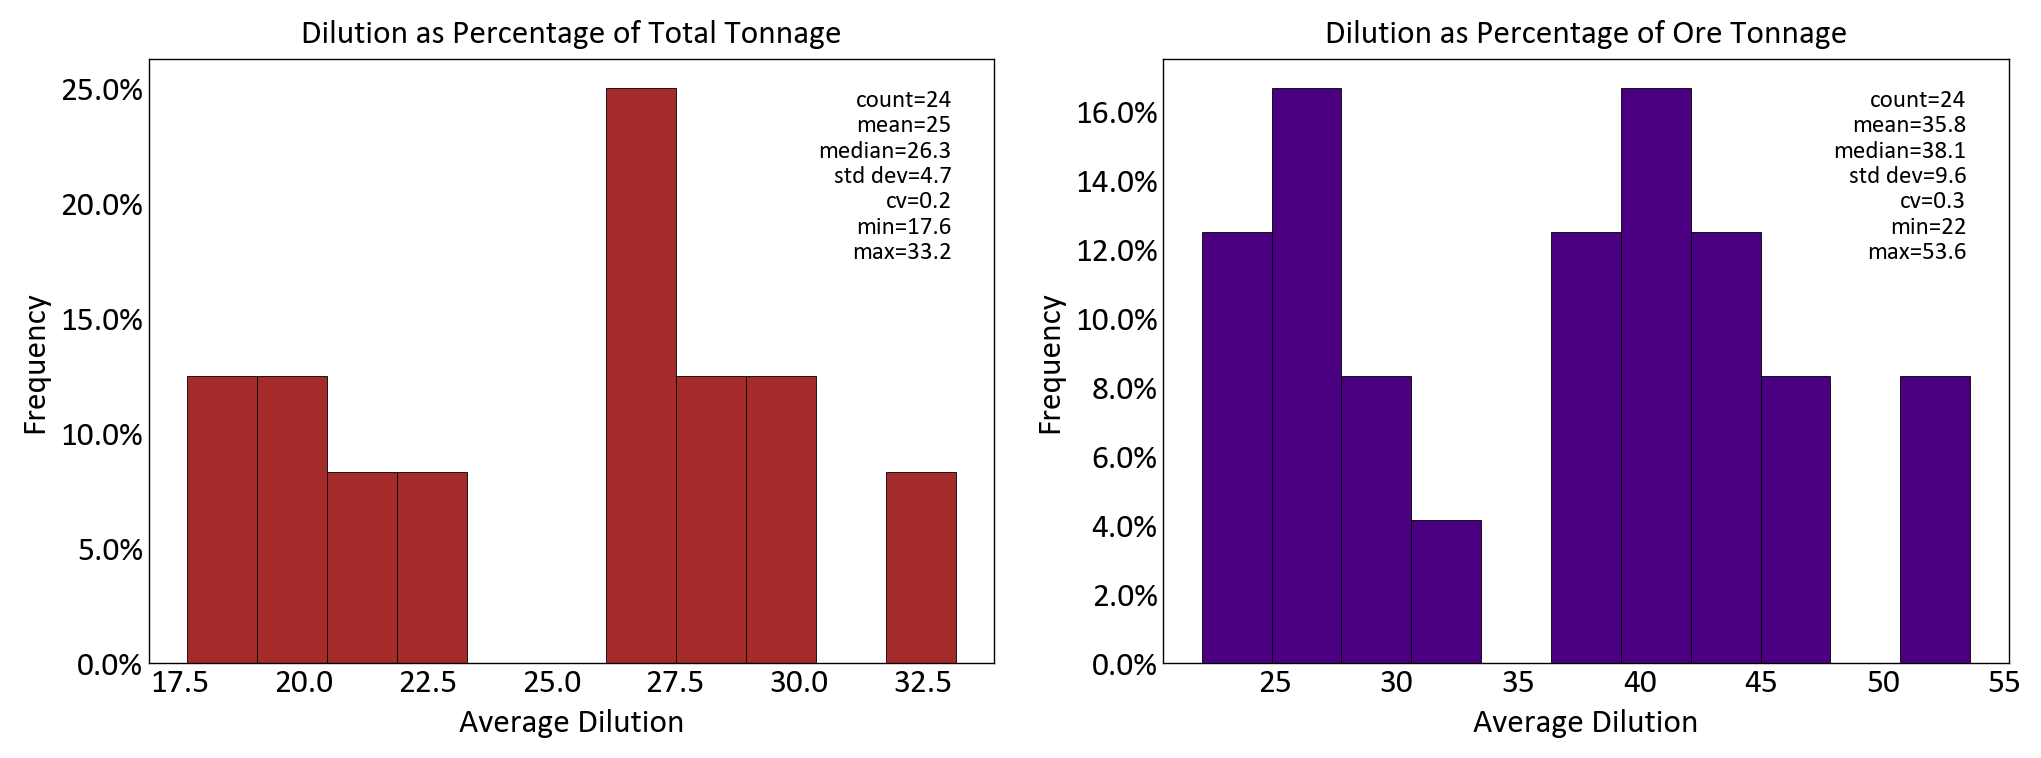
Source: Micon, 2020.
Micon’s ability to apply python scripts to the work process described here can also be applied to many of your routine work processes and can help save you time and increase employee productivity. To find out more please contact Nigel Fung, B.Sc.H, B.Eng., P.Eng., or Samer Hmoud, MSc, P.Geo., MAusIMM(CP) via the Contact-us page on this website.
0 Comments